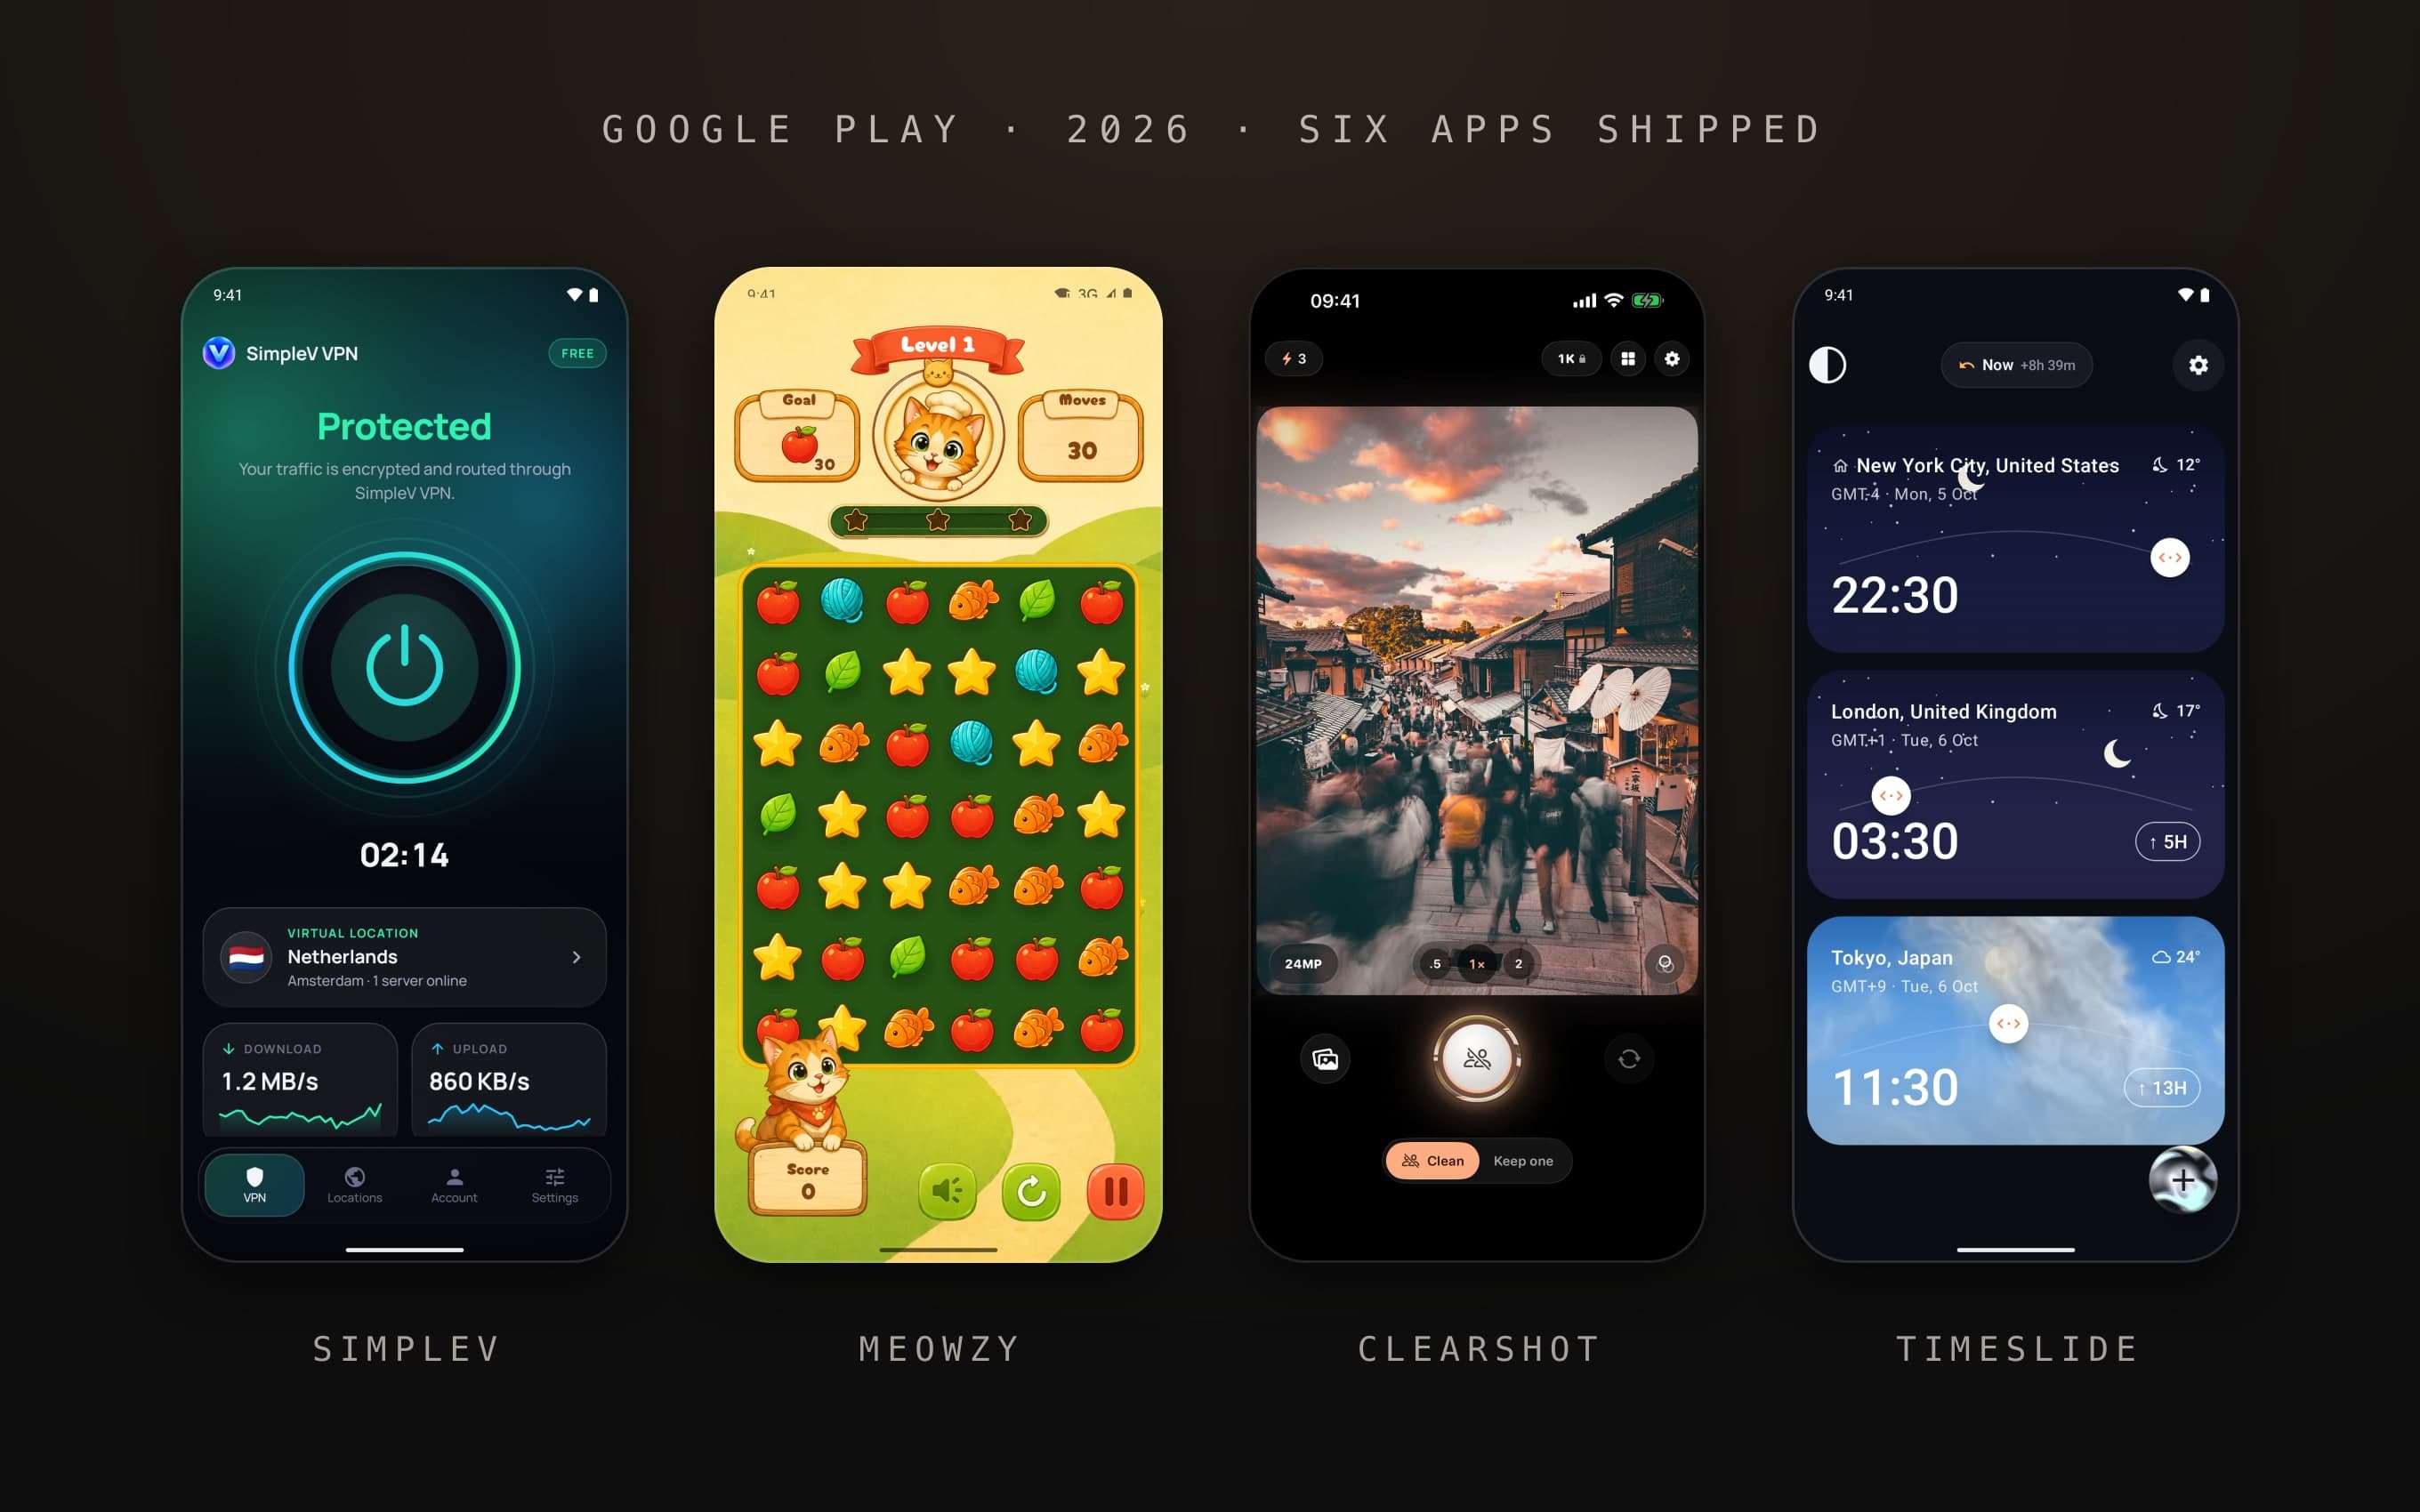









Founders planning an app MVP usually budget the build and forget the second bill: getting the first people to install it. We build and run our own apps, and we pay for their installs with the same tools a founder would use, Google App campaigns for Android and Apple Ads for iOS. This post puts our actual numbers on the table, by app and by market, so you can plan a launch test with real figures instead of guesses.
Where these numbers come from
The Google figures come from a daily export of our Google Ads account, covering 14 to 27 October 2026. Every campaign below is a Google App campaign that optimises for installs, and an install is what Google Ads counts as a conversion for that app: a download from Google Play. The Apple figures were read from the Apple Ads dashboard on 26 October 2026 for the previous 12 weeks. All amounts are in US dollars, the currency both accounts bill in.
The apps are SimpleV, a VPN; Timeslide, a world clock; My Chess Rating, a chess rating tracker; and ClearShot, an AI camera. All are live on Google Play. This post covers the cost side only: what it took to get someone to install, not what an installed user is worth.
Google App campaigns: cost per install by app and market
| Campaign and period | Impressions | CTR | Cost per click | Installs | Cost per install |
|---|---|---|---|---|---|
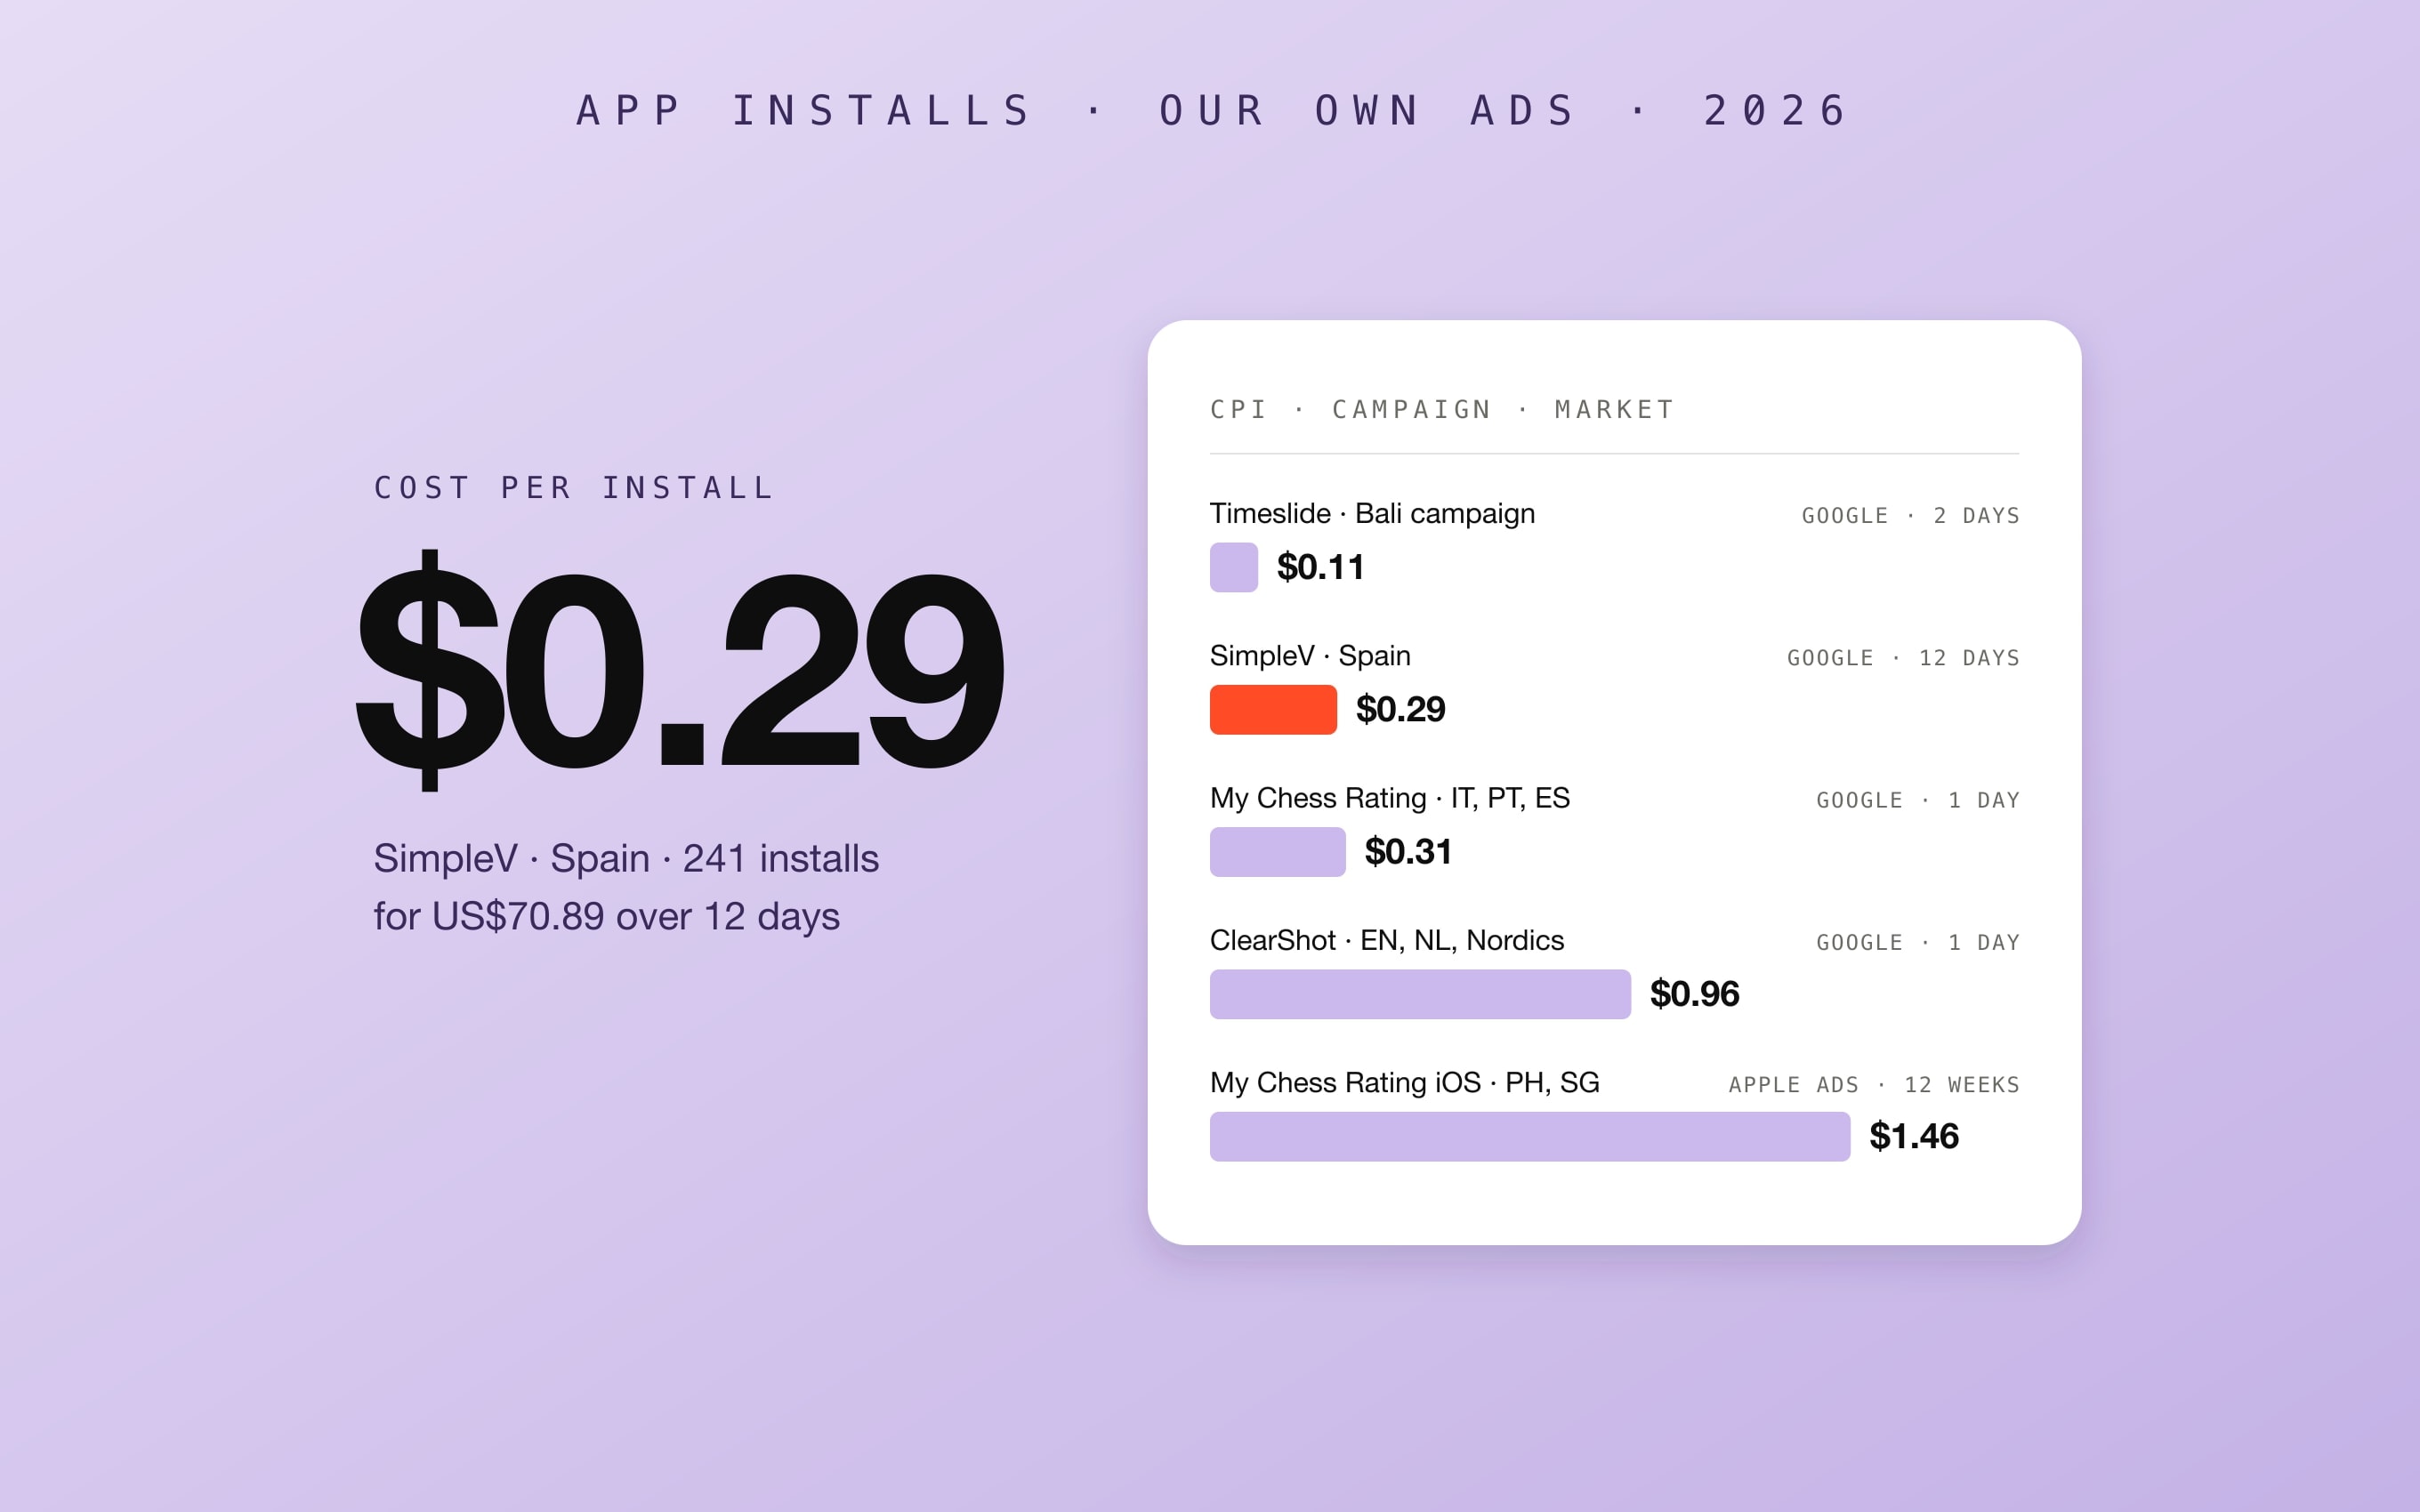
| SimpleV · Spain · 14–27 Oct (12 days) | 23,961 | 2.65% | $0.11 | 241 | $0.29 |
| Timeslide · Bali, Indonesia · 25–26 Oct | 734 | 15.67% | $0.03 | 28 | $0.11 |
| My Chess Rating · Portugal · 14 Oct | 332 | 7.83% | $0.07 | 8 | $0.22 |
| My Chess Rating · Italy · 14 Oct | 167 | 10.18% | $0.09 | 5 | $0.30 |
| My Chess Rating · Spain · 14 Oct | 208 | 8.65% | $0.07 | 2 | $0.67 |
| ClearShot · English, Dutch, Nordics · 14 Oct | 941 | 2.98% | $0.17 | 5 | $0.96 |
| Timeslide · Germany and Austria · 14 Oct | 173 | 3.47% | $0.20 | 1 | $1.23 |
Across all seven rows: 26,516 impressions, 845 clicks, US$84.67 spent and 290 installs, or $0.29 per install on average. SimpleV carries most of that weight. Only one day of the My Chess Rating, ClearShot and German Timeslide campaigns falls inside the export, and the Bali (Indonesia) campaign ran for two days, so treat those rows as snapshots. The German row is a single install and says nothing on its own; it is listed so the table hides nothing.
SimpleV is the one stable series. Its daily cost per install moved between $0.22 and $0.47, and the two most expensive days were the first day of the export and the first day after a two-day pause. Over the 12 days it spent about $5.90 a day and brought in about 20 installs a day.
Apple Ads: an iOS install cost about five times more
| My Chess Rating iOS · Philippines and Singapore · 12 weeks | Result |
|---|---|
| Spend | US$16.06 |
| Impressions | 1,735 |
| Taps (tap-through rate) | 63 (3.63%) |
| Cost per tap | $0.25 |
| Installs (taps that became installs) | 11 (17.5%) |
| Cost per install | $1.46 overall; $1.19 to $1.61 by campaign |
Eleven installs is a small sample, and the countries differ from the Android campaigns, so the gap mixes platform and market. Still, $1.46 against $0.22 to $0.30 for the same app on Android in Portugal and Italy is a big enough difference to plan around. If your MVP launches on iOS first, budget for installs that cost several times what Android installs cost, and do not assume Android numbers carry over.
What the numbers say for an MVP launch
- The market moves the price as much as the app does. On the same day, My Chess Rating installs cost $0.22 in Portugal and $0.67 in Spain. Across all our campaigns the cheapest install cost $0.11 and the most expensive $1.46, a spread of more than ten times.
- A high click-through rate does not guarantee cheap installs. My Chess Rating in Spain had an 8.65% CTR and still cost $0.67 per install, because only 2 of 18 clicks became installs. SimpleV had a 2.65% CTR and cost $0.29, because 38% of its clicks installed the app.
- The store listing is part of acquisition. The step from click to install happens on the store page, and across our campaigns it ranged from 11% to 38% of clicks. Screenshots, the first lines of the description and the listing's language decide that step, so the listing deserves the same care as the app itself.
- Do not judge a campaign on a single day. SimpleV's daily cost per install ranged from $0.22 to $0.47, and the most expensive day was the first one after a two-day pause. Google recommends waiting 7 to 14 days after changes before evaluating an App campaign.
- Category matters. For contrast, a click on our own B2B search ad for web development in New Zealand cost $3.86 on average over the same weeks, more than thirteen SimpleV installs. A consumer utility and a business service are bought in very different auctions.
How to budget the first launch test
Google's guidance for App campaigns that optimise for install volume is a daily budget of at least 50 times your target cost per install (Google Ads Help). At a $0.30 target that is $15 a day; at $1.50 it is $75 a day. SimpleV ran at about $6 a day and still produced a steady reading, only more slowly. Simple arithmetic on the costs we measured shows how far a test budget goes:
| Cost per install we measured | Where | 100 dollars buys | 1,000 installs cost |
|---|---|---|---|
| $0.11 | Timeslide, Bali, Indonesia (2 days) | about 900 installs | about $110 |
| $0.29 | SimpleV, Spain (12 days) | about 345 installs | about $290 |
| $0.96 | ClearShot, English, Dutch and Nordic markets (1 day) | about 100 installs | about $960 |
| $1.46 | My Chess Rating iOS, Philippines and Singapore (12 weeks) | about 68 installs | about $1,460 |
- Start with one platform and one or two markets. A test spread across five countries buys a few installs in each and a clear answer in none.
- Test the funnel where installs are cheaper, then pay for your core market. At $0.29 an install, $100 buys about 345 people to learn from; at $1.46, about 68. Fix the listing and onboarding on the cheaper traffic, then spend in the market you actually want.
- Localise the listing for the market you test. Our SimpleV campaign for Spain ran in Spanish, and several of our apps ship store listings in eight or more languages.
- Set up install tracking before the first dollar. Google Ads needs a conversion for the app's installs, and every campaign should report installs, not just clicks. Without it, the campaign optimises blind and you cannot compute any of the numbers above.
- Plan at least two weeks per test. That covers the 7 to 14 days Google suggests and leaves room for one change, such as new screenshots.
Installs are not users
Everything here counts installs as Google Ads and Apple Ads report them. An install tells you the ad and the listing worked; it does not tell you whether the person opened the app twice. Before the test starts, decide which in-app action makes someone a real user for your MVP, such as finishing onboarding or creating an account, and measure the cost of that action as well. That cost is always higher than the cost per install, and it is the number your launch plan should rest on.
Our numbers also have limits worth stating plainly. The budgets were small, the period was short, the apps are consumer utilities, and most of the volume comes from one app in one country, SimpleV in Spain. Cost per install depends on the category, the country, the platform and the season, so use these figures as a starting estimate for your own test, not as a benchmark.
Where launch ads fit in an MVP
An app has to be live in the store before any of this can run, and on Google Play that takes longer than most founders expect; we wrote up what actually delays a Google Play launch. Once it is live, the first paid test answers the question an MVP exists for: will people you do not know install it, and what does each one cost?
In our MVP development work, launch campaigns and funnel measurement are part of the scope: we set up Google App campaigns and Apple Ads, track click-through rate, cost per click and cost per install, and hand you the numbers with the product. We design and build the apps themselves as part of mobile app development, natively for Android and iOS or cross-platform.